Articles › Systems & Processes
Systems & ProcessesBuild a Real-Time Finance Dashboard for Your Business
Learn how a fractional Finance Director builds a real-time finance dashboard that gives directors live visibility of revenue, cash, margin and KPIs — without waiting for month end.
Business moves fast. Waiting until the eighth working day of the month to find out how the previous month went is increasingly frustrating for directors who want to manage their business proactively. A real-time finance dashboard solves this by giving you live visibility of your most important financial metrics — revenue, cash, margin, and the KPIs that matter most — without waiting for month-end accounts to land.
Yes, a fractional Finance Director can build and maintain a real-time finance dashboard for your business. The right design depends on your systems, your business model, and what you actually need to see. Here is how it works in practice.
What a Real-Time Finance Dashboard Actually Delivers
A real-time finance dashboard is not a replacement for monthly management accounts. The two serve different purposes. Management accounts are a complete, reconciled picture of financial performance for a period. A finance dashboard is a live indicator of the metrics that matter most day to day — the equivalent of a pilot's instrument panel rather than a full engineering report.
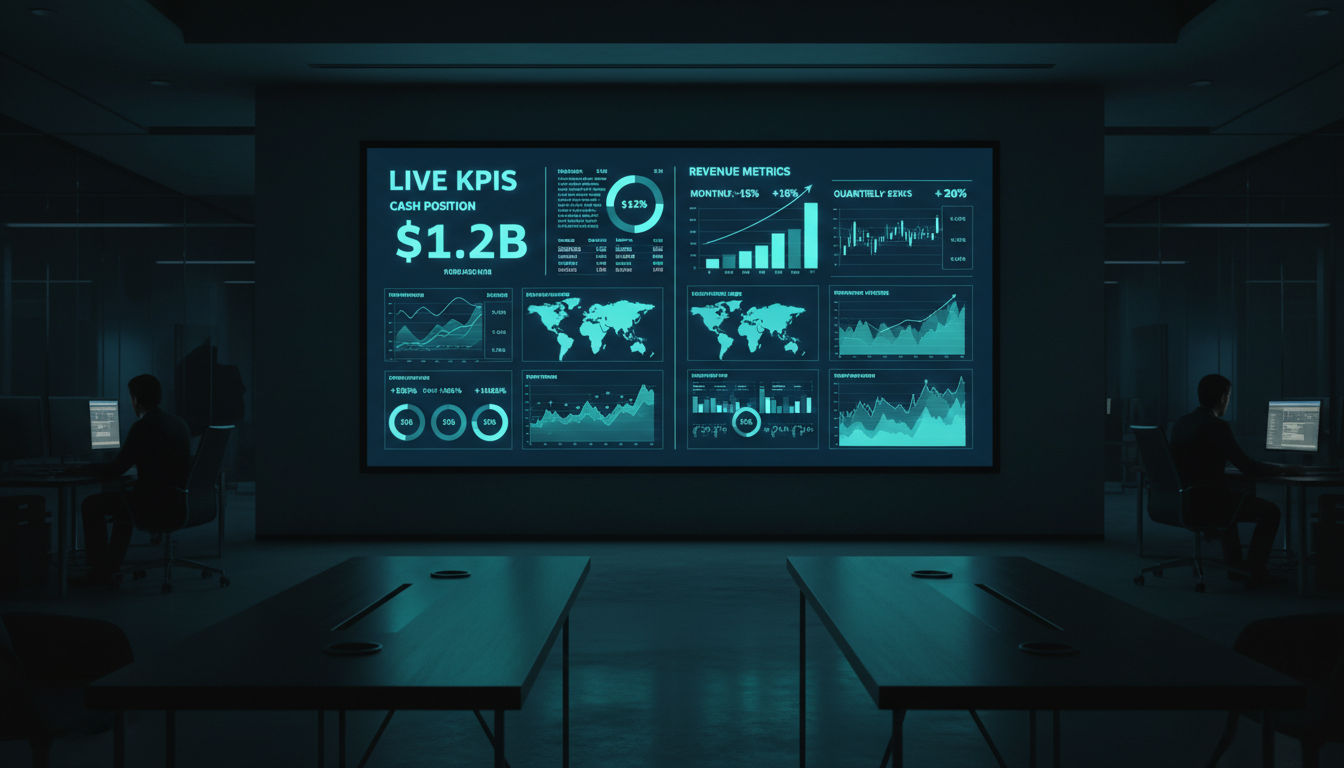
A well-designed dashboard will typically show:
- Revenue to date in the month versus target and prior year
- Current cash balance and rolling cash forecast
- Gross margin percentage, updated as sales and cost data flows in
- Debtors outstanding and overdue — how much cash is owed and when it is due
- Creditors — upcoming payments and cash commitments
- Key operational KPIs relevant to your business model
The Difference Between Real-Time and Near-Real-Time
Genuinely real-time data requires that your accounting system is being updated continuously — which in practice means bank feeds are active, invoices are posted promptly, and automated integrations are pulling data from your sales and operational systems. In many SMEs, the data is updated daily or every few hours rather than the moment a transaction occurs. This is "near-real-time" — and for management purposes it is more than sufficient.
What Tools Are Used to Build Finance Dashboards
The most common approach for SMEs is to build the dashboard directly within your existing accounting platform. Xero, QuickBooks, and Sage all have dashboard and reporting features that can be configured to show key metrics. The advantage is simplicity — the data is already there and there is no additional integration required.
For more sophisticated dashboards — particularly where you want to combine financial data with operational data from CRM systems, project management tools, or sales platforms — a separate business intelligence tool is often more appropriate. Microsoft Power BI, Google Looker Studio, and Fathom are all commonly used for this purpose and can pull data from multiple sources into a single view.
Choosing the Right Approach for Your Business
The choice of tool should follow the requirement, not the other way around. A fractional Finance Director will start by asking what decisions you need the dashboard to support. If you need to know whether you are on track to hit your monthly revenue target, a simple chart in your accounting software may be all that is needed. If you need to understand margin by client across three entities with data from your CRM, you need something more powerful.
"The best finance dashboard is the one your directors actually use. Complexity for its own sake helps nobody. Start with five metrics that genuinely drive decisions, and build from there."
Designing Your Dashboard Around Decisions, Not Data
The most common mistake in building finance dashboards is starting with the data that is available rather than the decisions that need to be made. The result is a dashboard with twenty charts that nobody looks at because none of them directly answer a question anyone is asking.
A fractional Finance Director will design your dashboard around a small number of key questions — typically four to six. What is our revenue doing this month? Are we on track for cash? Are our margins holding? What is the trend in our biggest cost categories? Each metric on the dashboard should be there because it informs a specific decision.
Once the dashboard is in place, it complements rather than replaces the monthly management accounts. The dashboard keeps directors informed between month-end reporting cycles; the management accounts provide the full, reconciled picture.
Access, Ownership, and Maintenance
A dashboard that is built and then forgotten quickly becomes misleading. Data sources change, new revenue streams are added, cost categories are restructured. A fractional FD will ensure your dashboard is maintained and updated as your business evolves, and will review it regularly to check that the metrics it displays remain the right ones.
Directors should have direct access — ideally via a browser or mobile app — so that they can check in on key metrics at any time without needing to ask the finance team for a report. This is one of the most significant improvements in day-to-day financial visibility that technology now makes possible for businesses of all sizes.
If you are also thinking about what reporting your board should receive, a finance dashboard can be a useful complement to formal board packs — giving directors context and live data before meetings rather than encountering numbers for the first time in a pack.